Parametric Design and Vibration Analysis of an Injection Robot Arm (Part Two)
Take the main arm beam of an injection robot arm as an example. See the Figure 2. The dimension features contained in Sketch 1 are D1@ Sketch1 and D2@ Sketch1. When the program is running, the corresponding dimension-driven form Fig.3 is automatically generated according to the main arm beam feature tree Fig. 2. The user inputs the corresponding parameters in the size-driven form, and clicks OK to complete the modeling of the main arm beam, which make it very convenient for the user to change the model. The parametric design process of the other parts of robot arms such as cases and the second arm beams is similar to that of the main arm beam, and they will not be described in detail here.
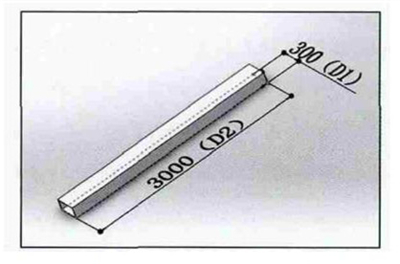
Fig.2 The model of the main arm beam of the injection robot arm
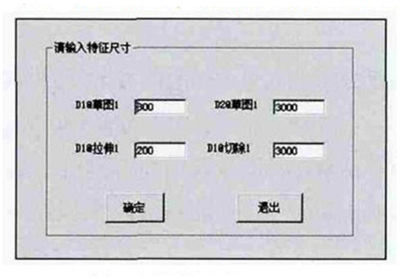
Fig.3 The driving form model of the main arm beam
3. Harmonic response analysis of an injection robot arm
Injection robot arms are generally subjected to continuous periodic loads during their work. Therefore, the harmonic response analysis of the robot arm is the key to vibration analysis. Ansys is used to obtain the response curves of the robot arms when they are subjected to loads that change normally over time. Through harmonic response analysis, predict the response of the robot arm to harmful phenomena such as resonance and forced vibration, and use this as an important basis for the optimal design of the robot arm. In order to simulate the actual working condition of the injection robot arm, a vertical downward sinusoidal excitation with an amplitude of 150N is applied to the bottom end of the second arm of the robot forearm, and the frequency variation range is from 0 to 200Hz. Fig.4, Fig.5 and Fig. 6 of the second arm of the robot forearm are obtained by Ansys software, which are the amplitude-frequency variation curves of the three degrees of freedom. According to the analysis of these three graphs, the amplitude of the three degrees of freedom reaches the peak at similar frequencies. This frequency is approximately around 60Hz, and the displacement in the y direction is 4.7mm. Therefore, when the robot arm is subjected to an excitation load with a frequency of about 60Hz in the working state, the robot arm will generate excessive vibration, which will affect the stability of the robot arm during the work process. Effective methods must be used to reduce the vibration.
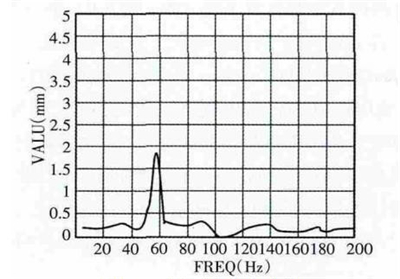
Fig.4 x-direction harmonic response amplitude curves
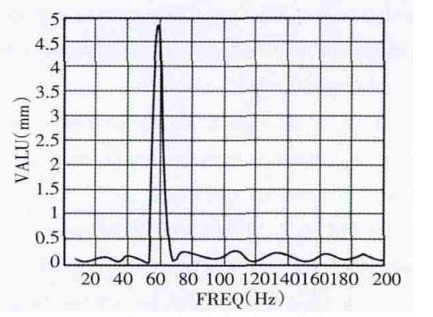
Fig.5 y-direction harmonic response amplitude curves
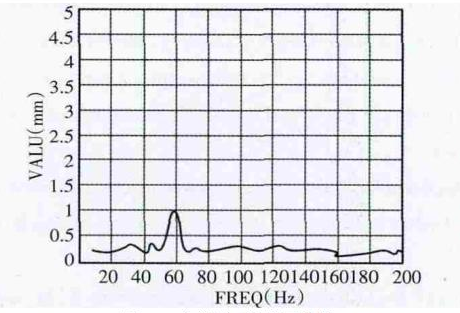
Fig.6 z-direction harmonic response amplitude curves
4. Optimization and analysis of the main arm beam
The main arm beam is an important part of the injection robot arm. In order to achieve the goal of reducing vibration, the optimal design of the main arm beam is our priority solution. The topology optimization function of Ansys is used here to optimize the main arm beam, and obtain the material density cloud picture of the topology optimization result of the main arm beam, as shown in the Figure 7. According to the material density cloud picture, holes are drilled on the main arm beam to reduce the mass by 7.8kg. The optimized structure of the main arm beam is shown in the Figure 8.
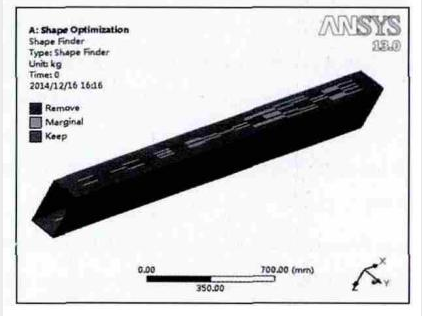
Figure 7 The optimized cloud diagram of the main arm beam
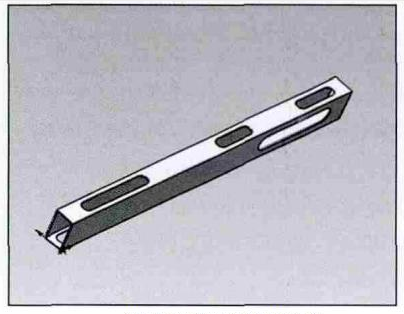
Figure 8 The optimized result of the main arm beam
In the same way, the harmonic response analysis of the robot arm is performed, and simple harmonic excitation of the same size, direction, and frequency variation range is applied to the bottom end of the optimized second arm of the robot forearm. Fig.9, Fig.10 and Fig.11 of the second arm of the robot forearm are obtained by Ansys software, which are the amplitude-frequency variation curves of the three degrees of freedom. Compared with the results before optimization, when the frequency is the same at about 60Hz, the amplitude of the three degrees of freedom of the robot arm in x, y, and z directions all reach the maximum, and the amplitude in the y direction drops greatly. It can be seen from the figure that the amplitude in the y direction is reduced by 66%; the amplitude in the x direction is reduced by 40%; and the amplitude in the z direction is reduced by 82%. The harm caused by the forced vibration effectively reduces for the robot arm, decreasing the vibration of the robot arm in the working process.
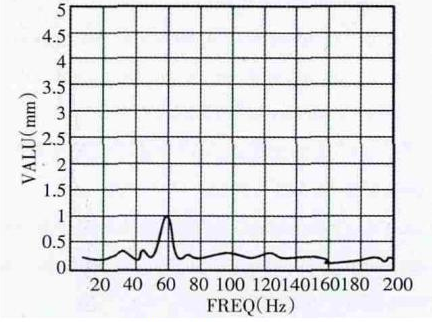
Fig.9 Optimized x-direction harmonic response curves
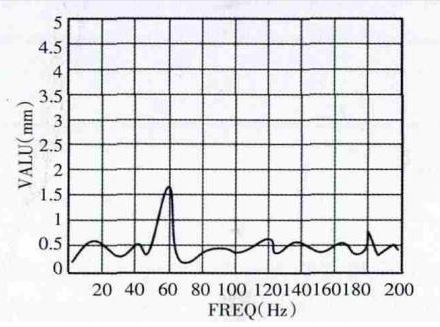
Fig.10 Optimized y-direction harmonic response amplitude curves
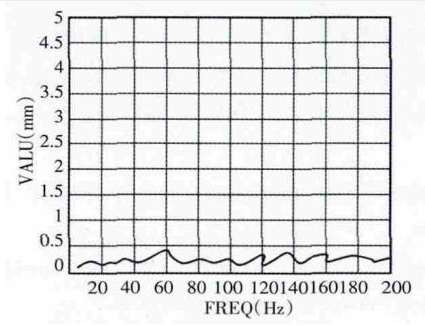
Fig.11 Optimized z-direction harmonic response curves
5. Conclusion
(1) Use VBA as a development tool to improve secondary development of traditional SolidWorks on the basis of principles and methods of parametric design, and the key components of the robot arm were parametrically designed, reducing the repetitive work of designers and improving design efficiency.
(2) Carry out harmonic response analysis and structural optimization of the designed injection robot arm, and use Ansys to optimize the topology of the main arm beam of the robot arm structure. Adopt the method of drilling holes on the main arm beam to remove materials of some minor parts, so that the mass distribution can be changed, decreasing the damage caused by the forced vibration to the robot arm and reducing the vibration of the robot arm in the working process.
Fig.2 The model of the main arm beam of the injection robot arm
Fig.3 The driving form model of the main arm beam
3. Harmonic response analysis of an injection robot arm
Injection robot arms are generally subjected to continuous periodic loads during their work. Therefore, the harmonic response analysis of the robot arm is the key to vibration analysis. Ansys is used to obtain the response curves of the robot arms when they are subjected to loads that change normally over time. Through harmonic response analysis, predict the response of the robot arm to harmful phenomena such as resonance and forced vibration, and use this as an important basis for the optimal design of the robot arm. In order to simulate the actual working condition of the injection robot arm, a vertical downward sinusoidal excitation with an amplitude of 150N is applied to the bottom end of the second arm of the robot forearm, and the frequency variation range is from 0 to 200Hz. Fig.4, Fig.5 and Fig. 6 of the second arm of the robot forearm are obtained by Ansys software, which are the amplitude-frequency variation curves of the three degrees of freedom. According to the analysis of these three graphs, the amplitude of the three degrees of freedom reaches the peak at similar frequencies. This frequency is approximately around 60Hz, and the displacement in the y direction is 4.7mm. Therefore, when the robot arm is subjected to an excitation load with a frequency of about 60Hz in the working state, the robot arm will generate excessive vibration, which will affect the stability of the robot arm during the work process. Effective methods must be used to reduce the vibration.
Fig.4 x-direction harmonic response amplitude curves
Fig.5 y-direction harmonic response amplitude curves
Fig.6 z-direction harmonic response amplitude curves
4. Optimization and analysis of the main arm beam
The main arm beam is an important part of the injection robot arm. In order to achieve the goal of reducing vibration, the optimal design of the main arm beam is our priority solution. The topology optimization function of Ansys is used here to optimize the main arm beam, and obtain the material density cloud picture of the topology optimization result of the main arm beam, as shown in the Figure 7. According to the material density cloud picture, holes are drilled on the main arm beam to reduce the mass by 7.8kg. The optimized structure of the main arm beam is shown in the Figure 8.
Figure 7 The optimized cloud diagram of the main arm beam
Figure 8 The optimized result of the main arm beam
In the same way, the harmonic response analysis of the robot arm is performed, and simple harmonic excitation of the same size, direction, and frequency variation range is applied to the bottom end of the optimized second arm of the robot forearm. Fig.9, Fig.10 and Fig.11 of the second arm of the robot forearm are obtained by Ansys software, which are the amplitude-frequency variation curves of the three degrees of freedom. Compared with the results before optimization, when the frequency is the same at about 60Hz, the amplitude of the three degrees of freedom of the robot arm in x, y, and z directions all reach the maximum, and the amplitude in the y direction drops greatly. It can be seen from the figure that the amplitude in the y direction is reduced by 66%; the amplitude in the x direction is reduced by 40%; and the amplitude in the z direction is reduced by 82%. The harm caused by the forced vibration effectively reduces for the robot arm, decreasing the vibration of the robot arm in the working process.
Fig.9 Optimized x-direction harmonic response curves
Fig.10 Optimized y-direction harmonic response amplitude curves
Fig.11 Optimized z-direction harmonic response curves
5. Conclusion
(1) Use VBA as a development tool to improve secondary development of traditional SolidWorks on the basis of principles and methods of parametric design, and the key components of the robot arm were parametrically designed, reducing the repetitive work of designers and improving design efficiency.
(2) Carry out harmonic response analysis and structural optimization of the designed injection robot arm, and use Ansys to optimize the topology of the main arm beam of the robot arm structure. Adopt the method of drilling holes on the main arm beam to remove materials of some minor parts, so that the mass distribution can be changed, decreasing the damage caused by the forced vibration to the robot arm and reducing the vibration of the robot arm in the working process.